

Now, it will be a lot easier to present digestible reports of your social media performance based on the essential metrics. You will be able to monitor which of them have increased or decreased in any given period.
How does it work?
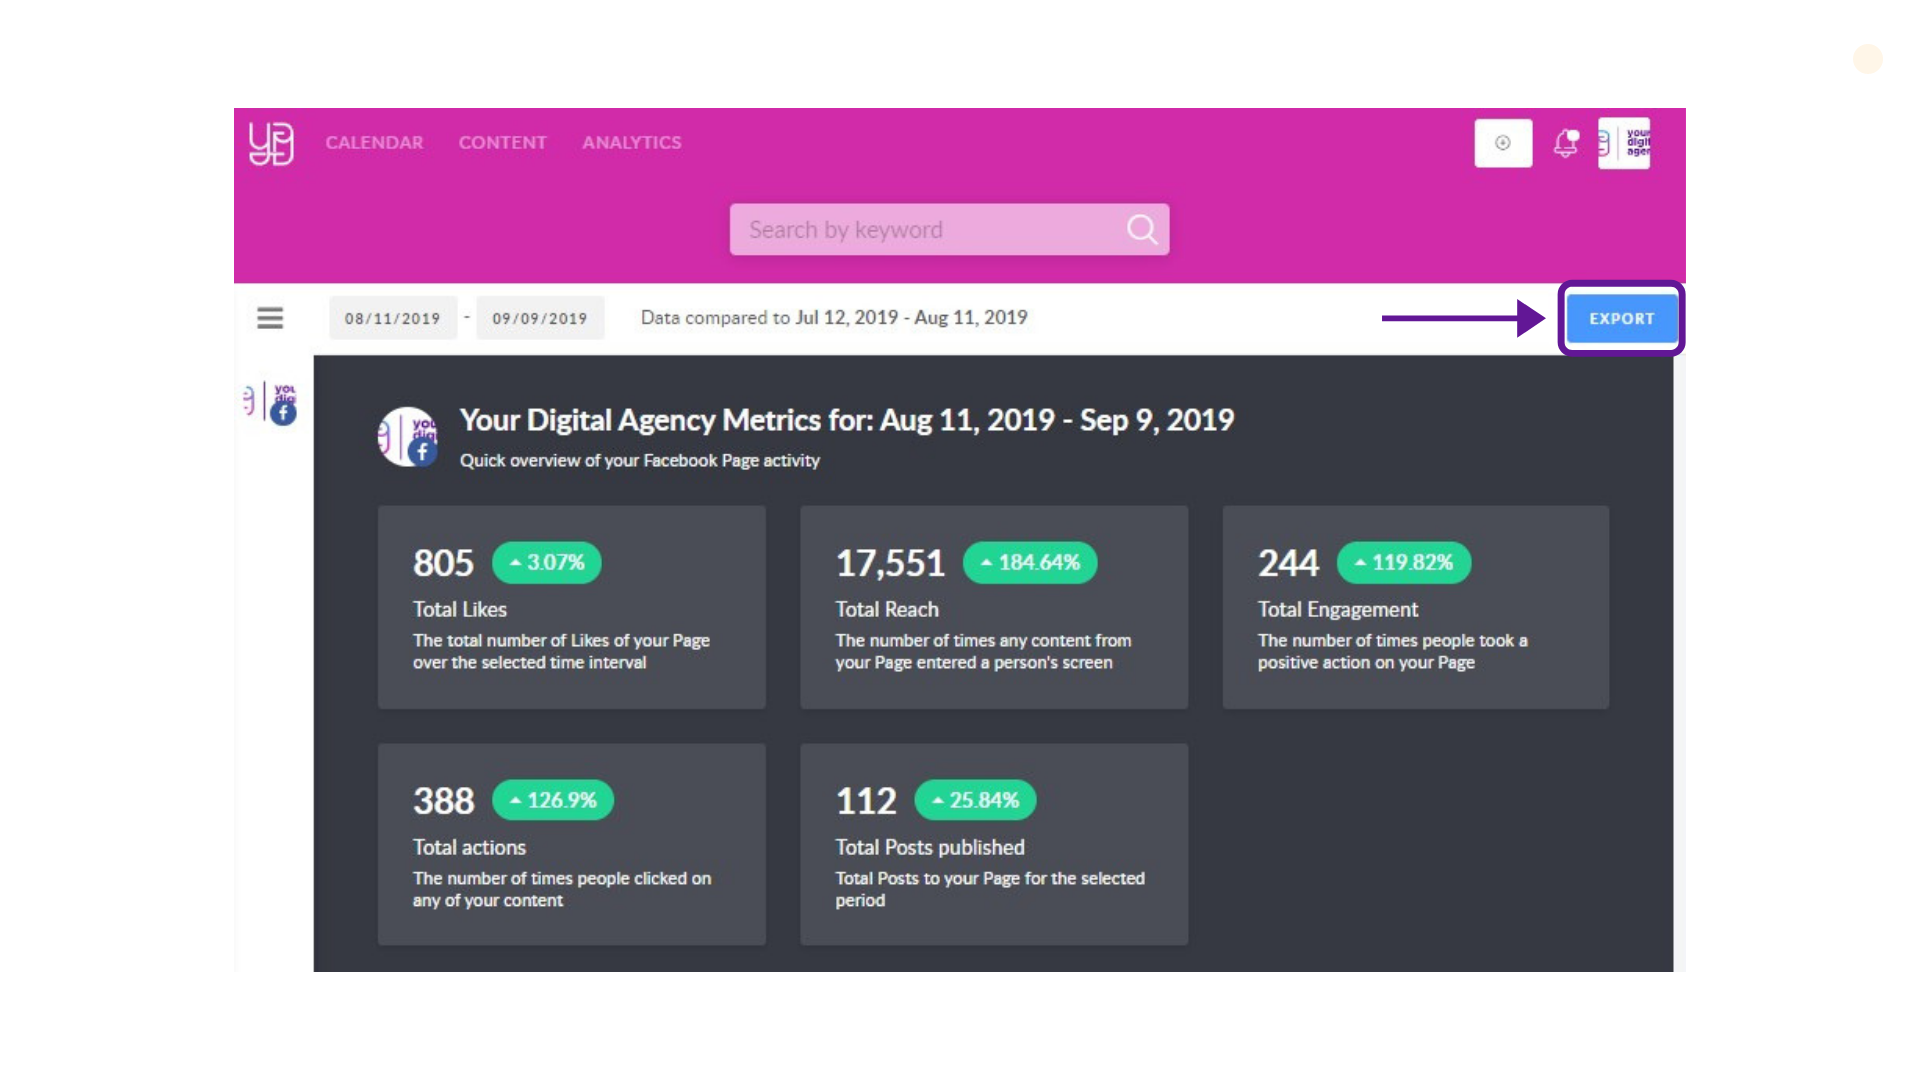
Find the Analytics button in the top bar and select Reporting from the drop down menu.
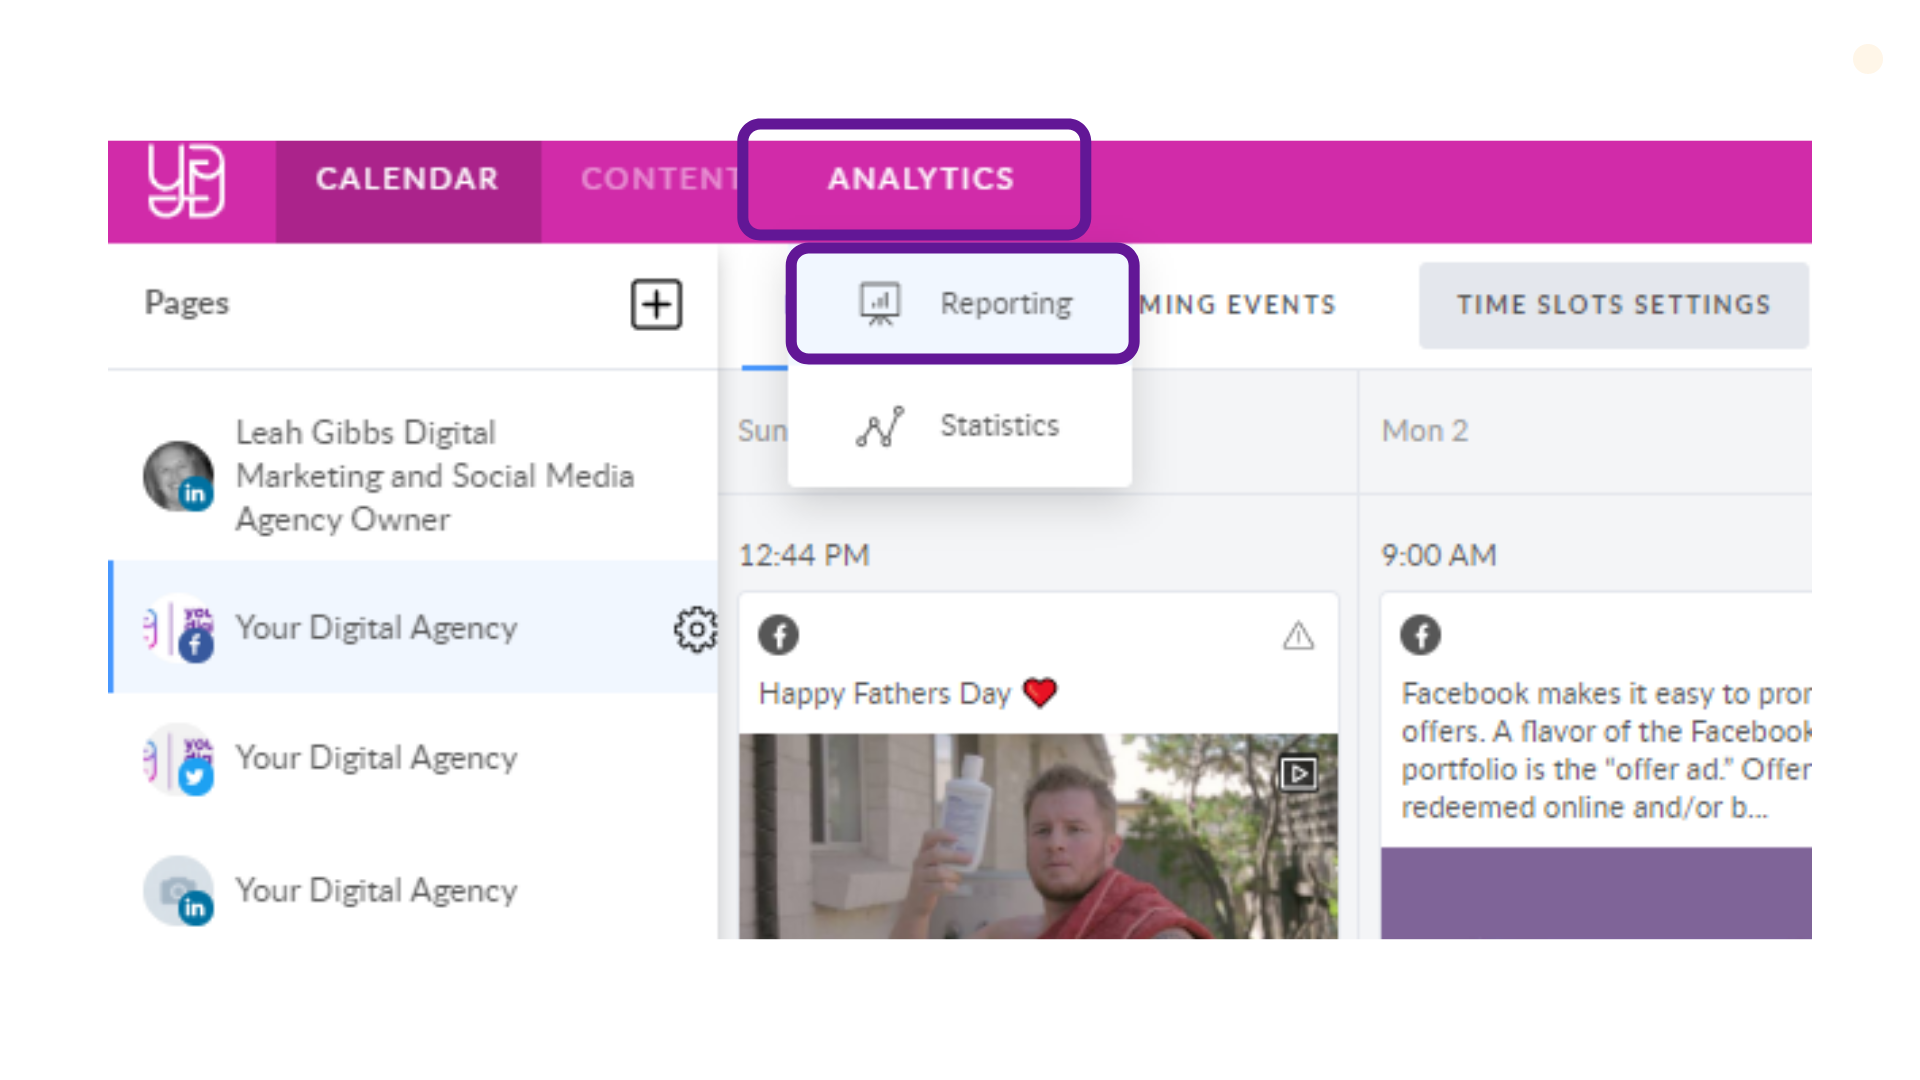
Please note that Reporting is presented per one page, meaning that we do not provide total stats for all the connected pages. To access a report, simply choose a page you want report for and you will see the numbers to the right momentarily.
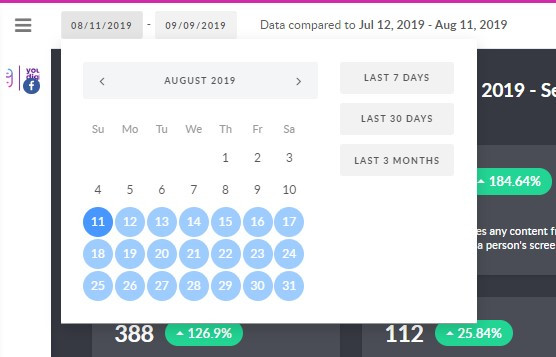
Next, choose the period of time that your client requires it for:
- custom
- last 7 days
- last 30 days
- last 3 months
What do the numbers mean?
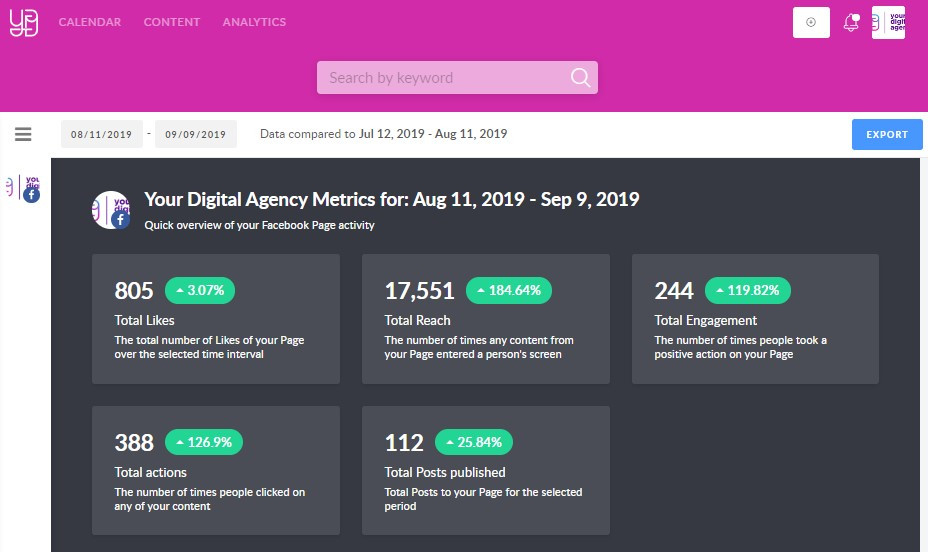
Now that you chose the necessary period of time, you can see the data divided in 4 key metrics:
- Total Likes
- Total Reach
- Total Engagement
- Total Posts Published
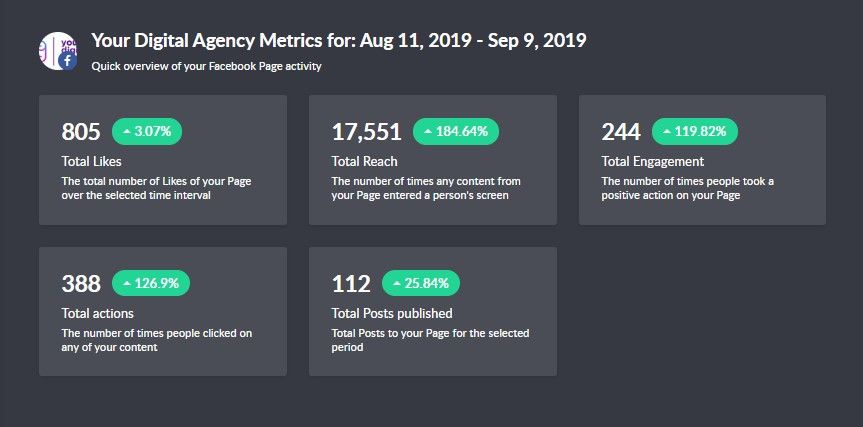
You see not only the numbers of the given period, but also previous time frame percents of the same duration for comparison.
For example, if you select last 7 days, percentage to the right will mean data of the previous 7 days.
In order to get a detailed overview of the received numbers in each of the four sections, just scroll down the page.
Export and download
If you desire to export the report, click the appropriate button in the top right corner.
If you need to download the file, click 'Open as PDF' in the printing settings window.